Biomechanical fatigue during maximal aerobic speed (MAS) intervals

We’ve all experienced that moment during a grueling workout or race when fatigue begins to set in. It’s when the “man with the hammer” looms closer, and suddenly, every movement requires extra effort. Our arms strain to pull a bit harder, and lifting our knees becomes a challenge. This fatigue not only affects our energy levels but also has a profound impact on our running technique (biomechanics) and how our bodies bear the load. Interestingly, this response to fatigue is highly individual and can ultimately determine whether we emerge victorious or fall short in a race. In this blog post, we aim to shed light on the changes in running technique (biomechanics) that occur during maximal aerobic speed interval training, offering you a real-life example to illustrate these transformations.

Training protocol

To provide you with a clearer understanding of the workout, let’s start with the concept of maximal aerobic speed (MAS). MAS is essentially the lowest running speed at which an athlete reaches their maximum oxygen uptake (VO2 max), often referred to as the velocity at VO2 max (vVO2 max). Endurance and team sports commonly employ MAS workouts to enhance an athlete’s aerobic power. There are various methods to determine your MAS, with this particular case relying on the 1200m shuttle run.

MAS intervals protocol

In this particular case, the athlete performed an interval session consisting of 10 repetitions. Each repetition involved running at a speed of 16 km/h, which corresponds to 95% of their MAS. Following each 3-minute interval, the athlete took a 2-minute recovery period at a reduced speed of 7 km/h, equivalent to 41% of their MAS. It’s worth noting that this training intensity zone is highly demanding, and maintaining optimal running quality throughout the session becomes crucial

Running quality - fast intervals
Trendlines running quality - fast intervals
In the graph displayed above, we present the running quality observed during each interval. Each dot on the graph represents the average performance recorded during a 3-minute interval performed at 95% of MAS.

A noticeable trend emerges—the runner’s ability to maintain good quality appears to be compromised, resulting in a significant decrease in both stability and impact loading scores. Specifically, we observe a drop of approximately ±23% in stability scores and approximately ±27% in impact loading scores. These findings shed light on the challenges faced by the runner in sustaining their optimal form and managing the impact forces associated with the intense training intensity. It emphasizes the importance of addressing stability-related factors to enhance running performance and reduce the risk of injuries.

Running quality - recovery intervals
Trendlines running quality - recovery intervals
The graph displayed above illustrates the running quality for each interval. Each dot represents the average performance recorded during a 2-minute recovery interval conducted at 41% of MAS.

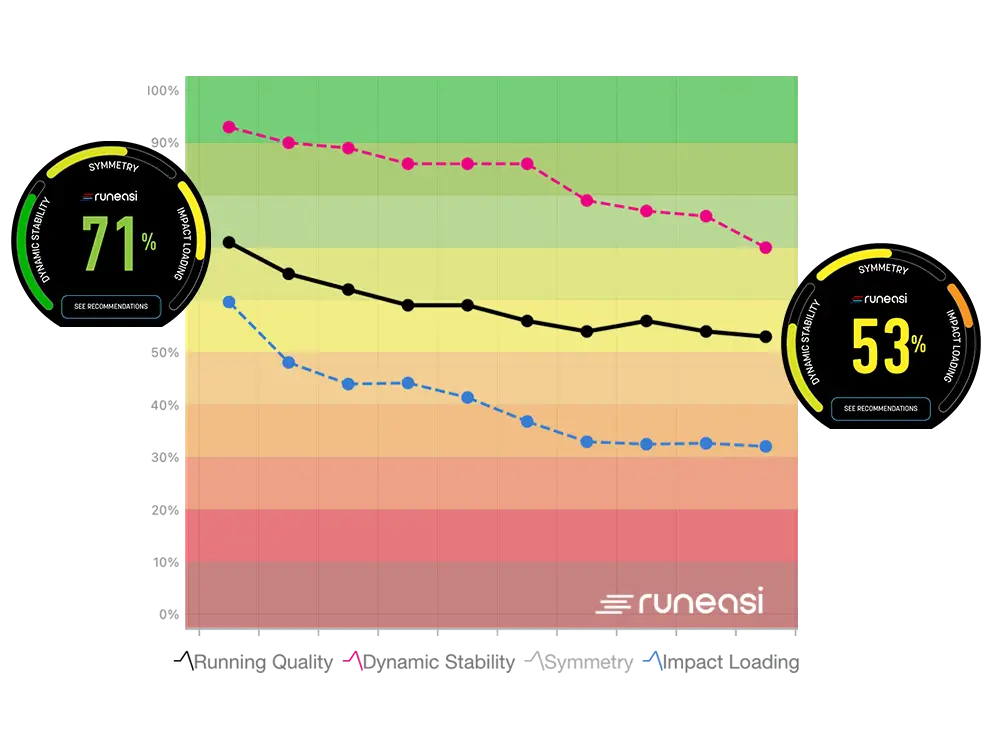
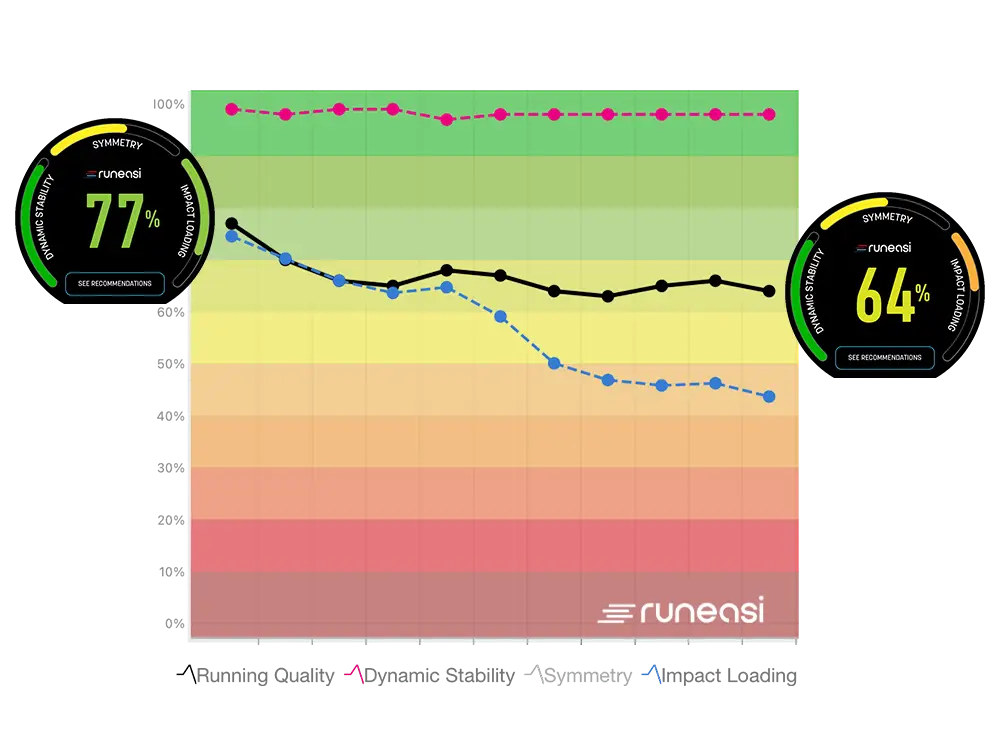
Fatigue affects not only fast running but also recovery intervals, compromising performance in both aspects. The graph reveals that the runner maintains good general pelvic stability throughout the intervals, but there are noticeable discrepancies in impact loading. These disparities primarily stem from diminished shock-absorbing abilities following intense intervals. Fatigue in the muscles responsible for absorbing shocks can impair their function.

"Utilizing biomechanical running data offers valuable insights for tailoring interval training to individual runners."

How can you utilize this data?
  1. Assess your running quality and identify the weakest links during high(er) speed intervals.
  2. Utilize the gathered data to devise a strategy for improving the weakest link.
  3. Evaluate susceptibility to biomechanical fatigue by comparing data from the beginning and end of the workout.
  4. Customize the training build-up for the next interval workout, including determining the appropriate number of repetitions and optimal recovery periods based on individualized data.

Preparing your runner for a next challenge?

Speak to a member of our Runeasi team, and learn how Runeasi can help you achieve your runner’s individual goals.

5 rEASONS TO USE OUR APP

1. Global movement quality

Track and improve your client’s Runeasi running quality. Identify their weakest link with our advanced visualisation.

2. individual recommendations

Get individual training and cueing recommendations to improve your client’s weakest link.

3. Real-time feedback


4. Session trends

Learn more about your client’s running quality during daily training. Our session trends show when and where the quality drops with fatigue.

5. Quick comparisons

Compare pre-post data to show intervention effects on the movement quality. 

3 REASONS TO CAPTURE DATA USING THE RUNEASI BELT

1. No motion artifacts. The Runeasi belt is secured tightly against the body and the skin to capture the actual movements of the body’s center of mass. Attaching or clipping the sensor directly to the pants would allow the sensor to wobble from side to side (i.e., measuring the wobbling of the pants, and not the human body.

2.  Easy to standardize the sensor’s positioning. The Runeasi belt makes it easy to consistently position the sensor close to the center of mass. Attaching the sensor directly to the pants would dramatically affect the reliability of the outputs as the height and tightness of the pants will affect the results. Moreover, these pants attachments often shift sideways while running which further decreases the data quality. 

 3. Comfortable to wear.  Hundreds of runners confirmed that they immediately forget about our belt while running. This allows them to move without any restrictions and allows us to capture movements that are representative of a client’s true biomechanics.

SENSOR SPECS

LAB GRADE SENSOR

Accurately captures full range of motion and kinetic parameters by leveraging wide sensing range (16 Gs) & high sampling frequency (1000 Hz)

WATER & SCHOCK PROOF

Built to withstand high intensity training and sweating. Suitable for the outdoor elements, come rain or shine. Robust to handle the repetitive and ruthless impact shocks of running.

Lightweight & SLIM

Seamlessly integrates onto the body to support movement without restrictions. Weight: 9.4g/0.33oz with battery. Dimensions (36.6mm/1.44” dia. X 10.6mm/ 0.42” thick)

No charging wireless

Replaceable coin-cell battery with operating time up to months, depending on the usage. Bluetooth® 5.0 radio for effortlessly transmitting data real-time or post-session.