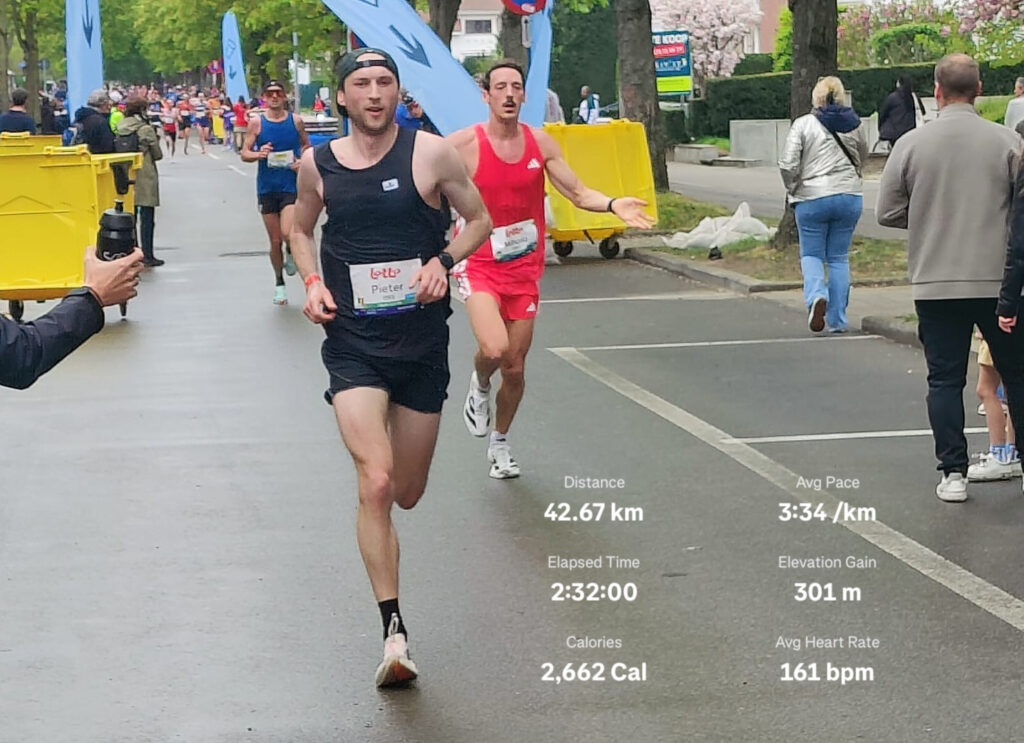
Last week, I ran the marathon at the European Running Championships. To be clear: I participated as an amateur. These championships were organized for the first time under the motto “Run with the champions,” where amateurs and elites ran the same race. I had been looking forward to it since it was announced two years ago, mainly because the finish line was in my hometown Leuven. And wow 🤩 — it did not disappoint! The atmosphere was amazing, and the race itself couldn’t have gone better. I ended up finishing in 2:31:59, a new personal best.
But enough about the marathon. That 42 km lap was nothing compared to the 1,750 kilometers I ran in the 18-week build-up to the race. Preparing your legs to handle the excessive pounding of a marathon is no joke. What sets the marathon apart from shorter distances is that the legs will give out long before the lungs do. At a certain point (usually around the dreaded 32 km mark), your legs start to hurt, making it hard to maintain the pace that had felt so easy before. That’s not due to a lack of fitness; it’s muscle fatigue.
There are different ways to prepare for that moment, but most require running a lot on tired legs. And that’s where it gets tricky. The goal is to practice running on tired legs without risking injury, which can be a very fine line to navigate.
That’s where runeasi comes in.
Runeasi is a wearable system that tracks running dynamics (things like impact loading, symmetry, and stability) and gives you feedback to help you move better. By identifying inefficient movement patterns early on, it also helps reduce the risk of injury and detect fatigue. I’m lucky enough to know a few people at Runeasi, and I jumped at the chance to test their product throughout my marathon preparation. In the remainder of this post, I’ll share three things I liked about the experience.
1. High-Quality Data
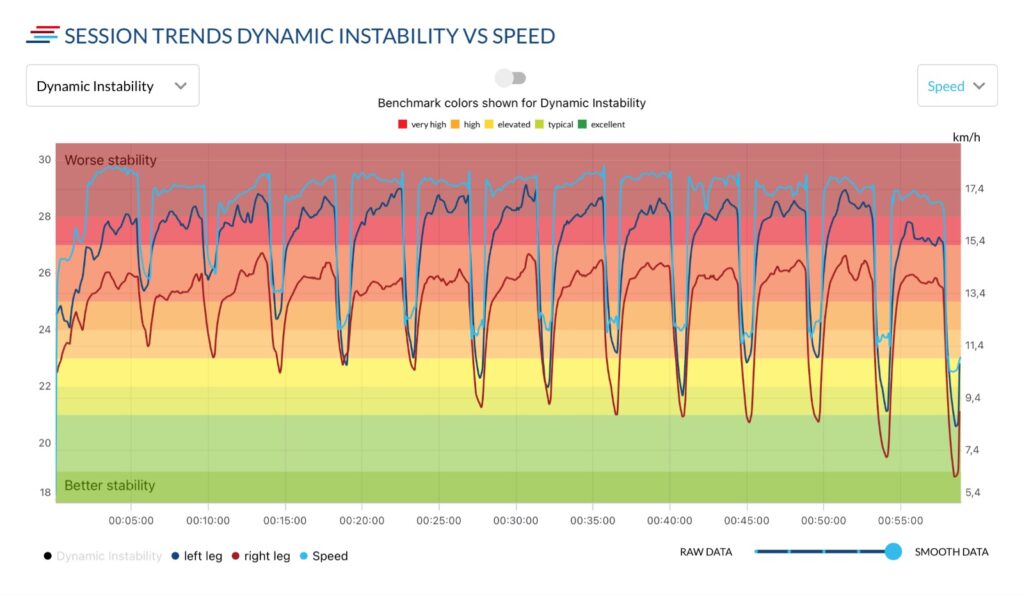
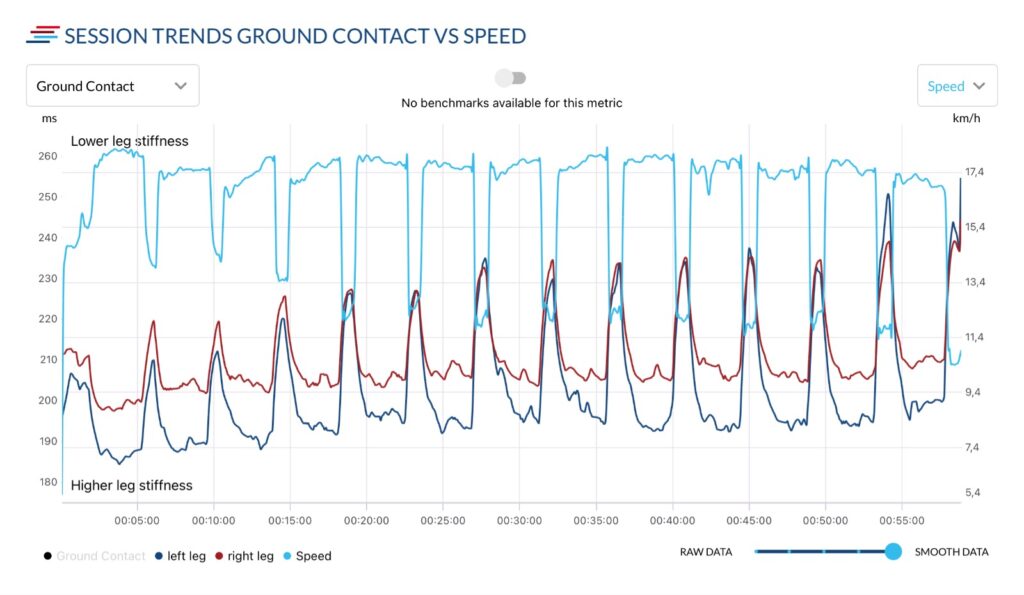
One thing that stood out to me right away was the consistency of the data. That might seem like a low bar, but measuring running dynamics is not that straightforward. Slightly change the position of the sensor or attach it more or less firmly, and the measurements will be different. But with the Runeasi sensor, I kept seeing the same pattern pop up: reduced dynamic stability on my left side and increased ground contact time on my right side. You can see it in the figure below, from a 13 x 1 km workout. In essence, this indicated that I wasn’t controlling my pelvis as well on the left during ground contact and was compensating by relying more heavily on the right.
When I discussed the initial results with the Runeasi team, they asked whether I’d had issues with my left Achilles. I’m not sure how much of that was luck, but they nailed it: I had been struggling with an inflamed Achilles tendon on that side for over a year. At the time, I don’t think it was fully recovered, but I no longer experienced any nuisances with it while running.
The same pattern showed up again and again, across different workouts and levels of fatigue. This convinced me that it wasn’t just random variation and led me to trust the data and actually do something with it.
What also impressed me was how sensitive the system was to small changes I wouldn’t have noticed otherwise. During that same workout, I felt great through the early reps and didn’t sense any fatigue. In the data that my Garmin collected, you couldn’t see any difference between the reps either. But the Runeasi data told a different story. My ground contact time gradually increased from the first rep to the last. That kind of slow shift is nearly impossible to feel in the moment, but it’s obvious in the data.
2. A Focus on Actionable Exercises
Next up: to do something with this data. Unlike some tools that push real-time gait retraining, Runeasi doesn’t try to force you into some idealized version of “perfect” running form by telling you how to change your running form on the fly. Instead, it helps you understand the why behind certain patterns, and then points you toward strength and mobility exercises that are designed to improve specific weaknesses or imbalances. In my case, that meant addressing the underlying stability issues that were likely contributing to the asymmetry I kept seeing.
Giving your body the muscular tools to run more efficiently makes more sense to me than trying to cue a more “perfect” running form mid-run. In the end, the most straightforward approach to improve most of these running dynamics metrics is to run faster. When you run faster, ground contact time decreases, cadence increases, vertical oscillation decreases, and vertical oscillation% decreases. Obviously, this is not sustainable and you can’t fake your way through 42 kilometers on good form alone — your body falls back on whatever it’s prepared to handle. So the best way to “fix” your form is to fix the foundation. Runeasi helped me do exactly that.
3. Measurable Feedback that Keeps You Motivated
As someone who loves data, I found it hugely motivating to get measurable feedback on my running dynamics. It’s one thing to know you should be doing strength or stability work; it’s another to actually follow through when everything feels fine and you could be spending that time running instead. The prospect of seeing measurable improvements in metrics like impact symmetry or stability gave real purpose to those (let’s be honest) boring exercises and helped me stay committed to doing them consistently.
And even though the data showed that my dynamic instability didn’t improve all that much over the course of the training block, it still played a big role in keeping me motivated. Seeing the same asymmetry pop up could’ve been frustrating, but instead, it gave me a clear reason to stay consistent with strength work — something I’ve often neglected in past buildups.
Most importantly, I made it through the entire 18 weeks injury-free. And for me, that’s a win.

Guest blog by Pieter Robberechts
Pieter discovered his passion for running after hanging up his football boots in 2020. Since then, he completed three marathons and has grown into a dedicated runner, always seeking out how to become just that little bit faster. Professionally, Pieter brings together his love for sports and data science. As a researcher at KU Leuven, he focuses on analysing sports data to uncover insights that help optimize training and prevent injury.